Seed decks sell a vision. Series A decks prove it with data. Here is what changes between stages.
Seed decks are built around vision, team strength, and market opportunity. Series A decks are built around proven metrics, unit economics, and a repeatable growth engine. The core shift is from selling a promise to proving a business.
Investors evaluate seed decks with roughly 70% weight on narrative and 30% on data. At Series A, that ratio flips. The metrics slide becomes the most scrutinized part of the entire presentation. Founders who pitch Series A the same way they pitched seed lose investor attention within the first three minutes.
This shift catches many founders off guard. Only 20-25% of seed-funded startups successfully raise a Series A round. Understanding exactly what changes in deck structure, content depth, and investor expectations are the difference between advancing and stalling.
How Does the Narrative Shift From Seed to Series A
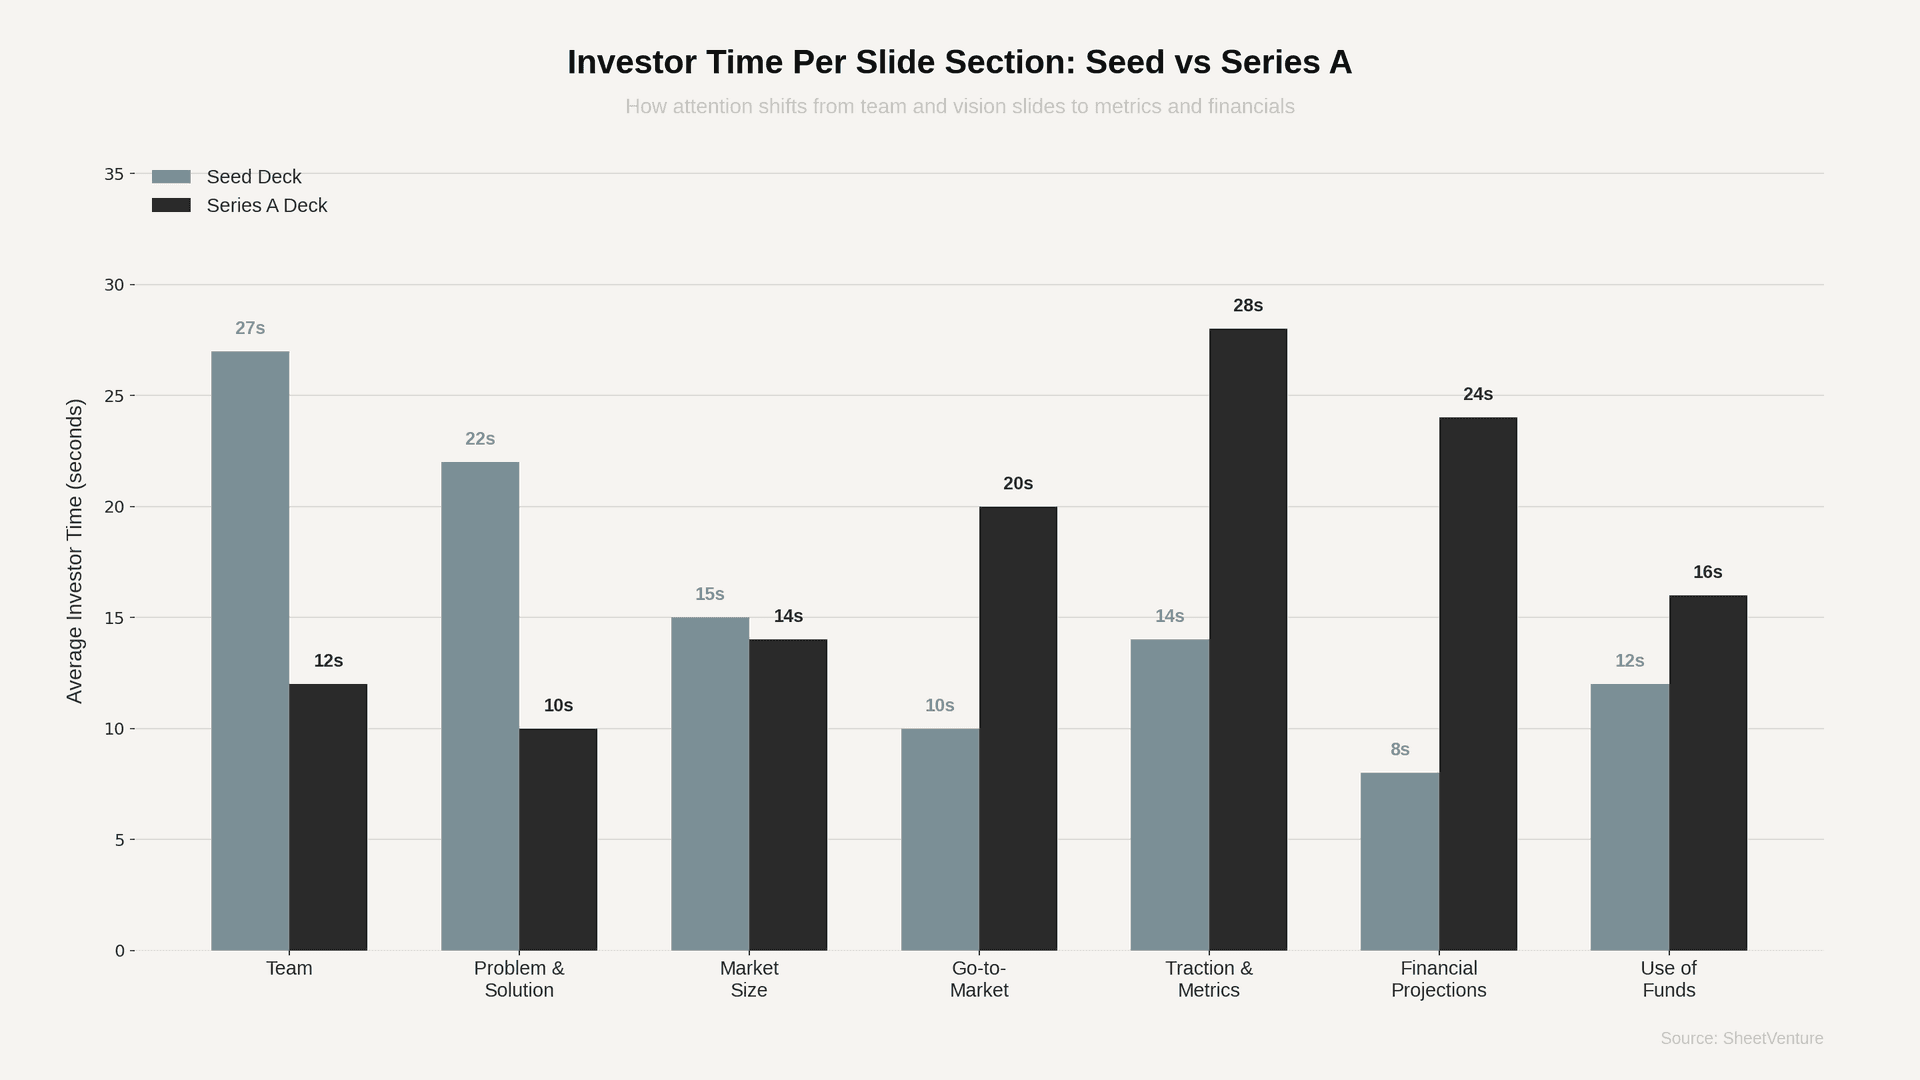
Seed decks lead with a story. The problem, the vision, and the founding team carry the weight. Investors at this stage are betting on people and potential.
Series A decks lead with evidence. Traction metrics open the conversation. The problem slide shrinks. The vision becomes a backdrop for proven results.
• Seed structure: Problem, Vision, Team, Market, Early traction, Ask.
• Series A structure: Key metrics, Product results, Unit economics, Growth engine, Team expansion, Financial projections, Ask.
• Seed investors ask, "Can this team figure it out?" Series A investors ask, "Is this business working?"
Founders raising a seed vs Series A round need to understand this structural inversion before building their deck.
What Metrics Do Series A Investors Expect That Seed Investors Don't
Seed investors accept qualitative validation. Customer interviews, waitlist numbers, and pilot feedback count as traction. Series A investors require quantitative proof that the business model works.
• ARR threshold: $1.5M-$3M for SaaS companies (up from $500K-$1M in 2021).
• Monthly churn: below 2% for SaaS, below 5% logo churn.
• LTV to CAC ratio: above 3:1 with a CAC payback under 18 months.
• Net revenue retention: above 100%, ideally above 120%.
• Growth rate: 2-3x year over year or 15-20% month over month.
Seed decks can skip most of these. Series A decks cannot. If founders are unsure what signals matter, reviewing what tells investors a startup is fundable clarifies the bar.
Which Slides Change Most Between Seed and Series A Decks
Four slides undergo the biggest transformation between stages.
Team slide. At the seed, this is often the most important slide. It highlights founder-market fit and domain expertise. At Series A, it shifts to show organizational growth. Key hires like VP Engineering or Head of Sales matter more than founder bios.
Financial projections. Seed decks include one high-level slide with rough three-year estimates. Series A decks need two to three slides with 18-24 months of historical financials, a bottom-up model, and unit economics that investors will rebuild from scratch.
Go-to-market slide. Seed decks present a hypothesis. Series A decks prove which channels work with data. CAC by channel, conversion funnels, and pipeline metrics replace assumptions.
Traction slide. Seed decks show early signals like beta users and pilot results. Series A decks make this the centerpiece. Retention curves, cohort analysis, and revenue trends must hold up to scrutiny.
Understanding what data belongs in your first pitch deck helps founders avoid overloading seed decks or underloading Series A decks.
What Should Founders Remove When Upgrading to a Series A Deck
Most advice covers what to add. Equally important is what to cut.
• Remove speculative market sizing. Replace top-down TAM claims with bottom-up validated numbers.
• Shrink the "Why Now" slide. Your traction already proves timing. One sentence is enough.
• Cut the long problem narrative. Series A investors already understand the space. Lead with results.
• Drop generic competitor matrices. Replace 2x2 charts with win/loss data and switching cost analysis.
• Remove vague use-of-funds slides. Map every dollar to specific hires, channels, and growth milestones.
Use investor intelligence tools to verify which investors prioritize data density over narrative at each stage.
The Bottom Line
Seed decks sell a future. Series A decks prove a present. The shift from vision-heavy to metrics-heavy is the single biggest structural change between funding stages. Founders who lead with their strongest metric instead of their problem slide signal Series A readiness. Every slide must answer "so what" with a number.
SheetVenture helps founders match their deck strategy to the right investors at every funding stage, so outreach targets the firms most aligned with their current traction.
Last Update:
Everything you need to understand private markets
Understand your market in real-time.
Filter by stage, sector, and exact geography.
Access 30,000+ verified, daily-updated active
