Discover which presentation analytics reveal real investor interest and how top founders use them to close rounds faster.
Six core metrics matter most: slide-by-slide view time, total duration, completion rate, forwarding activity, return visits, and drop-off points. Investors spend an average of 3 minutes 21 seconds on a pitch deck. These analytics tell you exactly who is interested and who is skimming.
Most founders send their deck and wait. They refresh their inbox and hope. But platforms like DocSend, Slidebean, and Pitch now give you real data on how investors interact with every slide. That data separates the VCs worth chasing from the ones who glanced and moved on.
The difference between founders who raise efficiently and those who burn months is tracking the right signals and acting on them. Here is what each metric tells you.
Core Metrics That Reveal Investor Interest
Not all analytics carry equal weight. These six give you the clearest picture of where an investor stands.
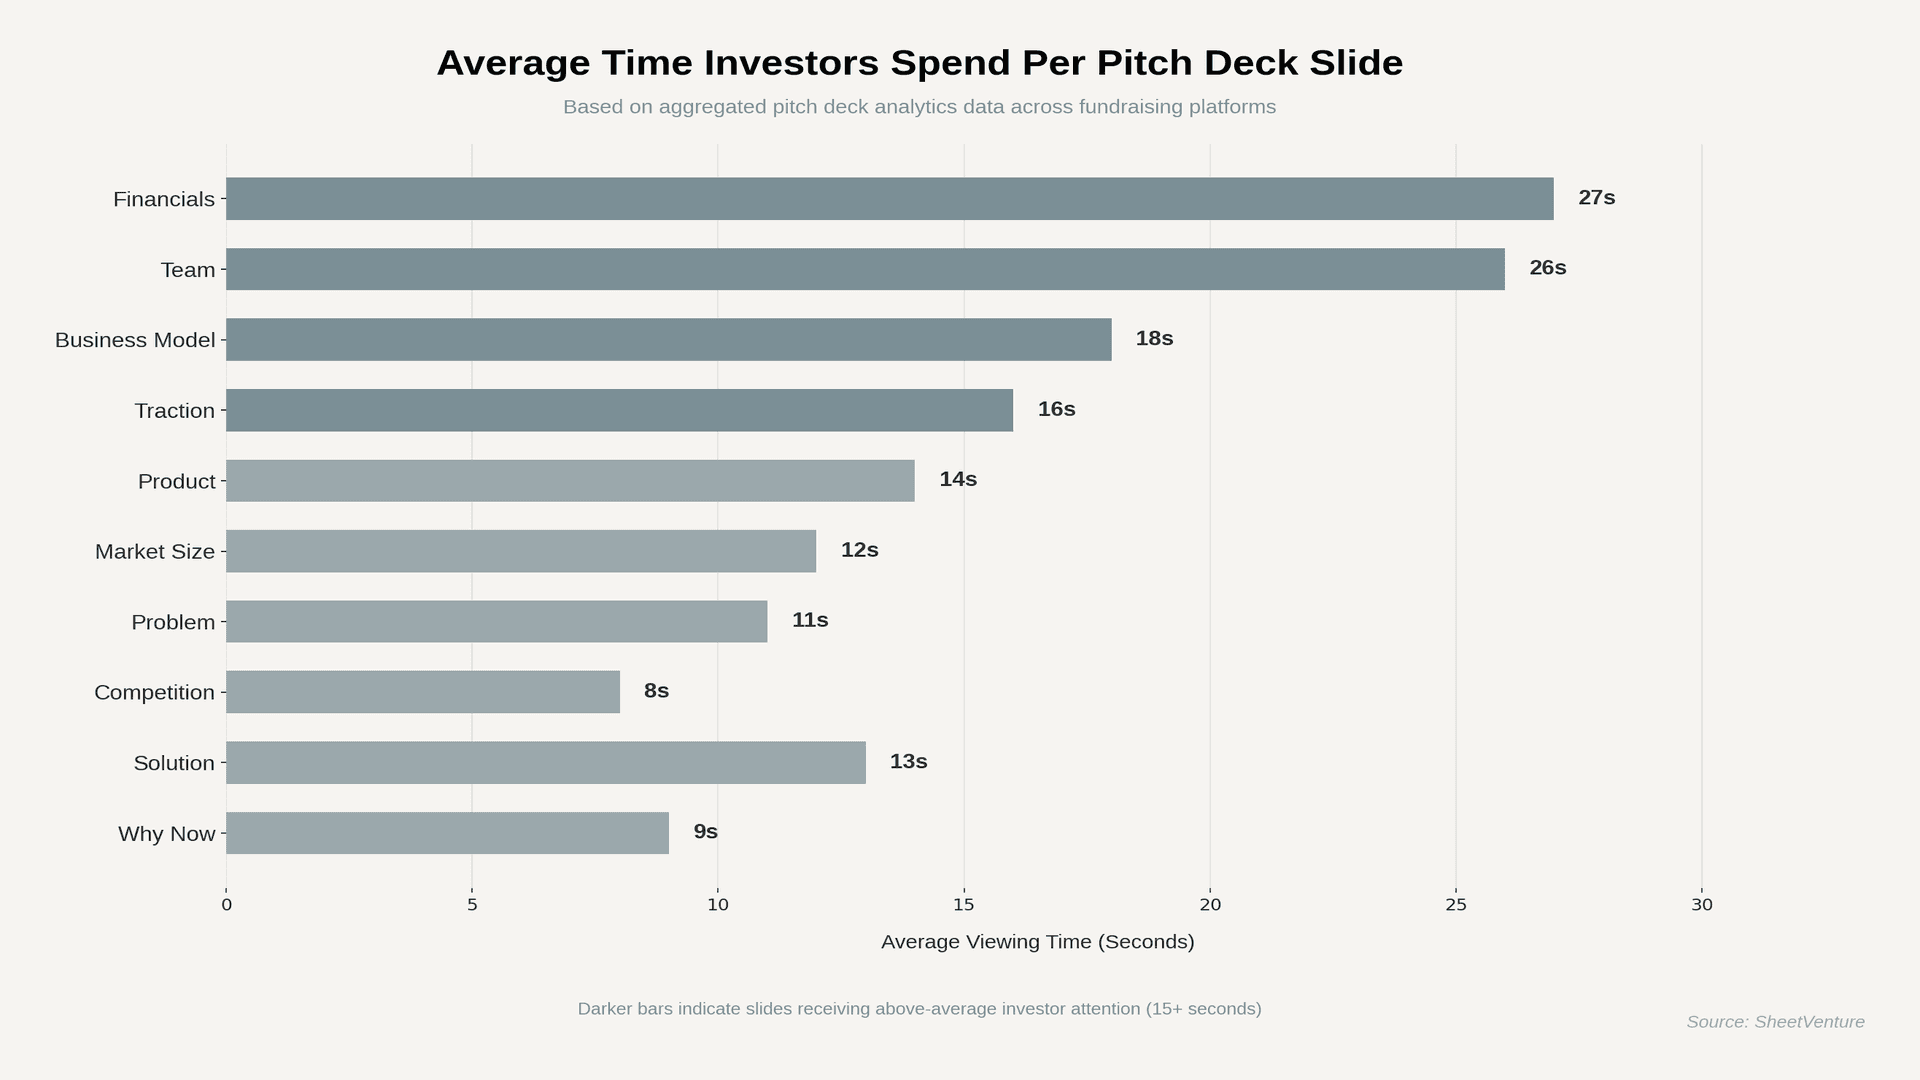
• Slide-by-slide view time shows which sections grab attention. Financials average 27 seconds per view. Team slides average 26 seconds. Competition slides get roughly 8 seconds. If an investor lingers on financials, they are evaluating deal potential.
• Total view duration measures overall engagement. The average is 3 minutes 21 seconds. Above 4 minutes signals a strong interest. Below 2 minutes usually means a quick scan with no follow-up intent.
• Completion rate tracks what percentage of slides were viewed. Roughly 54-67% of investors view an entire deck. Those who finish are significantly more likely to request a meeting.
• Forwarding and sharing detection is one of the strongest signals in fundraising. When an investor forwards your deck internally, someone is championing your deal. Same-day forwarding suggests genuine excitement.
• Return visits predict follow-up intent better than any single metric. An investor returning to your deck 2-3 times within a week is almost certainly considering it seriously.
• Drop-off points identify where investors lose interest. If most viewers exit after slide 6, that slide needs work. Knowing your pitch deck data drop-off pattern helps you restructure before the next send.
Understanding why investors disengage mid-review is just as valuable as tracking who stays.
Behavioral Signals That Predict Follow-Up
Raw numbers only matter when you read them together. A 4-minute view with full completion and a return visit the next day is a Tier 1 lead. A 90-second partial view with no return is Tier 4.
• Tier 1 (Hot): Multiple views, full completion, forwarding detected, return visits within 7 days. Spend 60% of your follow-up energy here.
• Tier 2 (Warm): Single complete view with above-average duration. Worth a personalized follow-up.
• Tier 3 (Cool): Single partial view with below-average time. Low priority unless a warm intro changes the dynamic.
• Tier 4 (Cold): No view or immediate close. Move on.
Device data adds context, too. A mobile view at 11 PM is a quick screen. The same investor returning to the desktop during business hours is doing a real evaluation.
How Founders Use Deck Analytics to Close Faster
Analytics only matter if they change what you do next.
• Time your follow-ups based on view data. If an investor views within hours, wait 24-48 hours before reaching out. Multiple views in quick succession? Follow up within 24 hours. A view after a 2-week silence deserves a fresh update with new traction.
• A/B test your deck. Create 2-3 versions with isolated changes. Track which version gets higher completion rates. Founders who iterate 3+ times during a raise see better outcomes than those who send a static version.
• Prioritize quality over volume. Use investor intelligence to identify VCs who match your stage and sector before sending. A targeted list of 50 investors who read your deck beats 200 cold sends.
Check this pitch deck guide for structuring slides that hold investor attention past the first 30 seconds.
The Bottom Line
Presentation analytics turn fundraising from guesswork into a data-driven process. The six metrics that matter most are slide-by-slide view time, total duration, completion rate, forwarding activity, return visits, and drop-off points. Financials and team slides command the most attention. Return visits and internal forwarding predict genuine interest better than anything else.
Stop guessing which investors care. Track how they engage with your deck and focus your energy on the data points.
SheetVenture helps founders track real investor engagement signals so outreach targets the VCs most likely to respond and invest.
Last Update:
Everything you need to understand private markets
Understand your market in real-time.
Filter by stage, sector, and exact geography.
Access 30,000+ verified, daily-updated active
