Prove scalability through improving cohorts, declining CAC, channel diversification, retention stabilization, and expansion revenue. Learn the five evidence types investors need.
Founders prove scalability through five evidence types: cohort performance improving over time, CAC decreasing with volume, multiple acquisition channels working profitably, retention curves flattening at healthy levels, and expansion revenue accelerating.
Traction shows what you've done; scalability proves it compounds. VCs invest in growth that strengthens, not growth that requires increasing investment to maintain.
Why Scalability Proof Matters
Understanding what separates traction from scalable traction explains investor scrutiny:
What traction alone proves:
Product works for some customers
Team can execute tactically
Market has some receptivity
Early validation exists
What scalability proves:
Growth compounds naturally
Economics improve with volume
Multiple growth levers exist
Path to venture-scale outcomes
For deeper context, understand when to start fundraising based on market signals and traction.
The Scalability Evidence Framework
Evidence Type | What It Proves | Key Metrics to Show | What Investors Look For |
|---|---|---|---|
Improving cohorts | Product-market fit strengthening | Retention, activation, LTV by cohort | Recent cohorts outperforming earlier ones |
CAC efficiency gains | Acquisition improving with scale | CAC trend, organic %, channel efficiency | CAC declining 15-30% as volume grows |
Channel diversification | Growth not dependent on one lever | Revenue by channel, CAC by channel | 3+ channels working profitably |
Retention stabilization | Value proposition sustainable | Cohort retention curves, churn rate | Curves flatten at 60%+ after 6 months |
Expansion acceleration | Customers increasing spend | NRR, upsell rate, ARPU growth | Net revenue retention above 110% |
The pattern: Each evidence type proves a different dimension of scalability.
The Five Scalability Proof Points
1. Cohort Performance Improving Over Time
Product-market fit is strengthening, not weakening:
What to show: Retention, activation, and LTV metrics by cohort. Recent cohorts should outperform earlier ones.
Key metrics: Month 6 retention by cohort, activation rate trends, LTV progression.
What investors ask: "Show me cohort retention for the last 12 months. Are newer cohorts better or worse?"
Red flag: Can't show cohort-level data or recent cohorts performing worse.
2. CAC Decreasing with Volume
Acquisition efficiency improving at scale:
What to show: CAC trending down as monthly spend increases. Organic channels growing as percentage of total.
Key metrics: CAC by quarter, organic acquisition percentage, payback period trends.
What investors ask: "How has CAC changed as you've scaled spending?"
Why it matters: Real product-market fit creates network effects that make acquisition easier, not harder.
Learn how investors evaluate customer traction quality.
3. Multiple Acquisition Channels Working Profitably
Growth not dependent on single lever:
What to show: Revenue contribution by channel. At least 3 channels hitting target CAC/LTV ratios.
Key metrics: Revenue by channel, CAC by channel, channel concentration risk.
What investors ask: "If your top channel stopped working tomorrow, what happens to growth?"
Target state: No single channel representing more than 50% of new customer acquisition.
4. Retention Curves Flattening at Healthy Levels
Customers staying for the long term:
What to show: Cohort retention curves that flatten at 60%+ after 6 months. Churn stabilizing at acceptable levels.
Key metrics: Month 6, 12, 18 retention by cohort, monthly churn rate.
What investors ask: "Show me retention curves. Where do they stabilize?"
Red flag: Continuous churn exceeding 5% monthly or inability to show retention curves.
5. Expansion Revenue Accelerating
Existing customers spending more over time:
What to show: Net revenue retention above 100%. Upsell and cross-sell rates. ARPU growth by cohort age.
Key metrics: Net dollar retention, expansion MRR, upsells as percentage of revenue.
What investors ask: "What's your net revenue retention?"
Target state: NRR above 110% demonstrating negative churn.
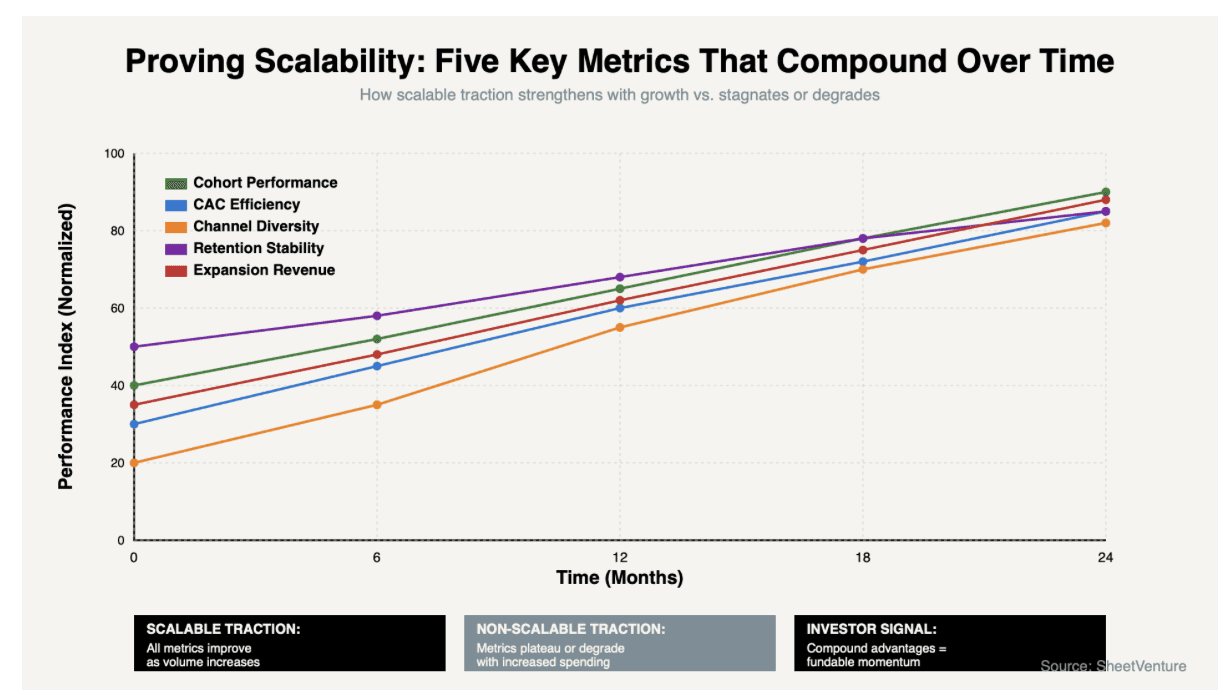
Scalability Trajectory Visualization
Below is the growth pattern that proves scalability to investors:
[Image showing the five key metrics trending positively over 24 months, demonstrating compound growth]
Questions Investors Ask to Test Scalability
Expect these diagnostic questions:
"Show me cohort performance over the last year, are they improving?"
"How has CAC trended as you've increased spending?"
"What happens to growth if your top channel stops working?"
"Where do your retention curves stabilize?"
"What's net revenue retention for customers past 12 months?"
Why they ask: Each question isolates whether growth compounds or requires increasing investment.
Use SheetVenture's intelligence to identify investors who prioritize scalable growth metrics.
How to Present Scalability Evidence
Prepare these materials: Cohort analysis showing progression over 12+ months. CAC trend charts by quarter. Channel attribution showing diversification. Retention curves for multiple cohorts. NRR calculation with expansion breakdown.
The principle: Let data prove growth strengthens over time rather than claiming it will.
Check SheetVenture's resources for frameworks on presenting scalability metrics effectively.
The Bottom Line
Founders prove scalability through five evidence types: cohort performance improving over time, CAC decreasing with volume, multiple acquisition channels working profitably, retention curves flattening at healthy levels, and expansion revenue accelerating.
Traction shows current results; scalability proves compound growth. Prepare cohort analysis, CAC trends, channel attribution, retention curves, and NRR metrics.
Traction gets meetings. Scalability gets term sheets.
SheetVenture helps founders identify and demonstrate the scalability signals that transform traction into fundable momentum.
Last Update:
Everything you need to understand private markets
Understand your market in real-time.
Filter by stage, sector, and exact geography.
Access 30,000+ verified, daily-updated active
