Research VC investment velocity through fund deployment timelines, deal frequency, portfolio dates, founder networks, and specialized databases. Learn the methods.
Founders research investment velocity through five methods: analyzing fund deployment timelines from announcement to first check, tracking deal announcement frequency patterns, examining portfolio company funding dates, leveraging founder networks for recent experience data, and using specialized databases tracking active deployment periods.
Investment velocity determines whether VCs can move quickly or require months of deliberation. Understanding check writing speed helps founders prioritize investors likely to close within their timeline and avoid those in analysis paralysis mode.
Why Investment Velocity Matters
Understanding how quickly VCs actually deploy capital explains fundraising timeline reality:
What fast investment velocity enables:
Shorter fundraising processes saving founder time
Ability to capitalize on market momentum
Reduced risk of deal falling apart over time
Less operational distraction from building
Competitive dynamics favoring founder terms
What slow investment velocity creates:
Extended diligence draining founder energy
Market conditions potentially shifting
Higher risk of deal death from prolonged process
Significant operational distraction
Investor leverage increasing over time
For deeper context, understand how long fundraising really takes.
Investment Velocity Distribution
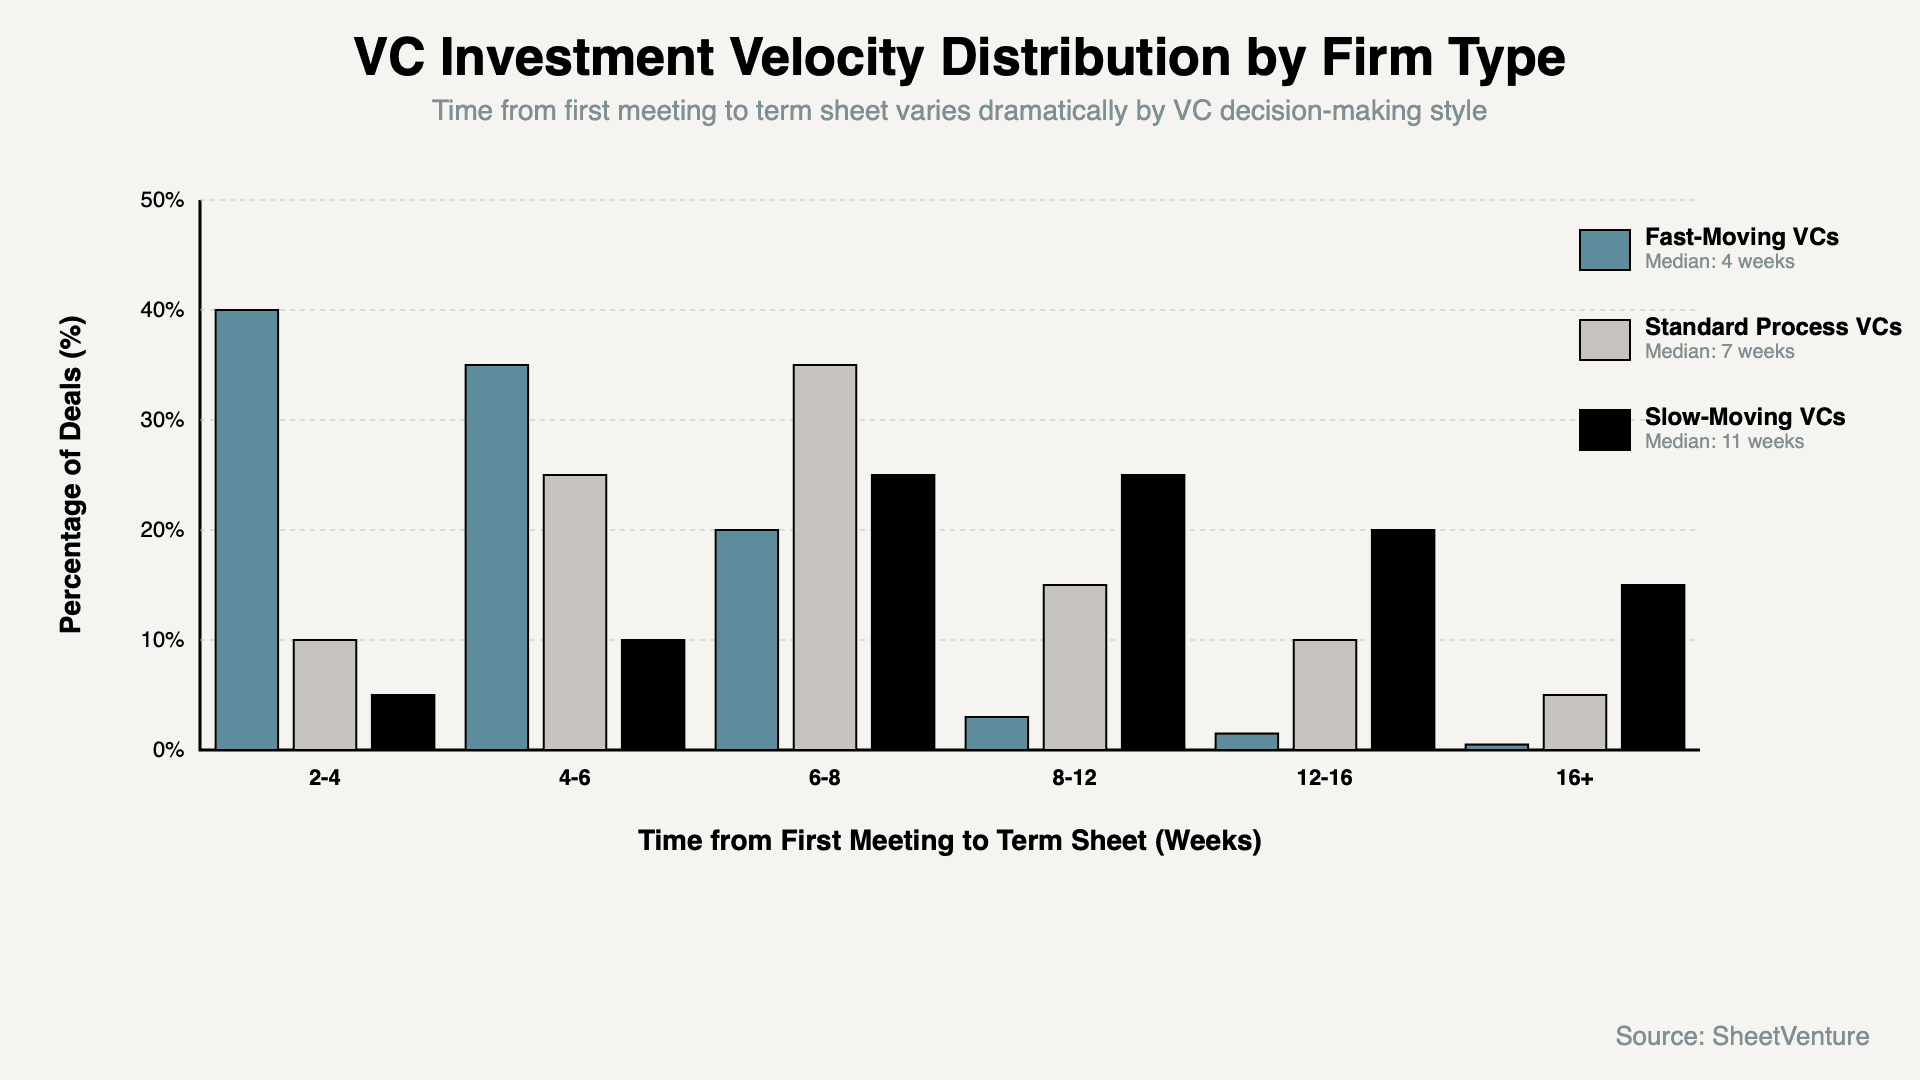
This visual immediately shows founders realistic timeline expectations by VC type.
The Five Velocity Research Methods
1. Analyzing Fund Deployment Timelines
Track how fast funds deploy after closing:
What to research: Fund announcement date, first portfolio investment date, number of deals in first 12 months.
Where to find data: Crunchbase Pro, PitchBook analytics, firm announcements, portfolio pages.
What patterns reveal: Fast deployers invest within 3-6 months of fund close. Slow deployers take 12-18 months for first deal.
Why it matters: Recently closed funds have urgency to deploy.
2. Tracking Deal Announcement Frequency
Monitor how often they write checks:
What to research: Investment announcements per quarter, clustering patterns, dry spells between investments.
Where to find data: Firm news pages, Twitter, Crunchbase activity feeds, portfolio updates.
What patterns reveal: Active funds announce deals monthly. Inactive periods exceeding 6 months signal caution.
Why it matters: Recent deal activity predicts near-term velocity.
Learn about what is deal velocity and why it matters.
3. Examining Portfolio Company Funding Dates
Reverse engineer decision timelines:
What to research: Date companies announced raise, date VC confirmed, time from first meeting to close.
Where to find data: Company press releases, Crunchbase funding dates, founder interviews, industry reporting.
What patterns reveal: Consistent 4-6 week timelines indicate efficiency. Variable timelines suggest inconsistent decision-making.
Why it matters: Historical velocity predicts future velocity.
4. Leveraging Founder Networks
Get real experience data from recent fundraisers:
What to ask founders: Total time from first meeting to term sheet, number of partner meetings required, typical response time.
Where to find founders: YC networks, industry Slack channels, LinkedIn groups, portfolio companies.
What insights emerge: Specific partner reputations, firm cultural patterns, recent process changes.
Why it matters: Firsthand experience reveals reality versus public positioning.
5. Using Specialized Databases
Leverage tools tracking active deployment:
What platforms offer: Harmonic showing activity scores, Affinity tracking engagement, Signal showing velocity, PitchBook analytics.
What data reveals: Funds currently most active, recent deal flow changes, partner-level activity patterns.
Why it matters: Aggregated data shows patterns individual research misses.
Check how to find active VCs for your startup.
Investment Velocity Indicators Table
Indicator Type | Fast Velocity Signal | Slow Velocity Signal | What It Predicts |
|---|---|---|---|
Recent fund status | Raised fund 6-18 months ago | Raised 3+ years ago | Urgency to deploy vs. cautious mode |
Deal frequency | 2+ deals per month | 1 deal per quarter | Decision-making momentum |
Partner availability | Respond within 24-48 hours | Week+ response times | Process efficiency |
Decision structure | Single decision-maker | Multi-layer approval required | Timeline predictability |
Competitive behavior | Known for moving fast | Never seen moving quickly | Ability to accelerate |
Fund size vs. check | $100M fund, $2-5M checks | $500M fund, $2-5M checks | Deal importance |
The pattern: Multiple fast signals suggest quick process; multiple slow signals suggest extended timeline.
Red Flags Indicating Slow Velocity
Warning signs to watch:
No deals announced in 6+ months. Fund raised over 3 years ago. Partners consistently slow to respond. Multiple approval layers mentioned. "We like to take our time" language.
Why these matter: Slow velocity wastes founder time and risks deal death.
Accelerating Slow-Moving Investors
Tactics that sometimes work:
Create genuine competitive dynamics. Share specific timeline pressure. Demonstrate strong momentum through metrics updates.
What doesn't work: Artificial urgency. Threatening to move on. Pushing on partners without decision authority.
Reality: Slow-moving VCs rarely accelerate dramatically. Better strategy is targeting naturally fast investors.
Use SheetVenture's intelligence to identify investors with fast deployment track records.
Velocity Varies by Deal Quality
Important caveat: All VCs move faster for exceptional deals. Fast-moving VCs close in 2 weeks for must-wins. Slow-moving VCs can close in 4-6 weeks when excited.
Implication: If VC who normally moves fast is dragging with you, it signals tepid interest.
The test: Are they moving slower than their typical pattern? That's a signal problem.
The Bottom Line
Founders research investment velocity through five methods: analyzing fund deployment timelines, tracking deal announcement frequency, examining portfolio funding dates, leveraging founder networks, and using specialized databases. Investment velocity determines whether VCs close in weeks versus months.
Research recent deal activity, fund age, partner responsiveness, and decision structure to predict likely timeline. Target investors with patterns matching your fundraising urgency.
SheetVenture provides real-time investor velocity data, so you target VCs who'll move at your pace, not drag your process.
Last Update:
Everything you need to understand private markets
Understand your market in real-time.
Filter by stage, sector, and exact geography.
Access 30,000+ verified, daily-updated active
