Series B investors demand specific traction benchmarks before writing checks. Here are the five metrics that decide outcomes.
Series B investors expect $5M to $15M ARR, 3x year-over-year growth, 120% net revenue retention, 70% gross margins, and CAC payback under 18 months. Hit four of five, and you are fundable.
Series B is where capital stops rewarding potential and starts demanding proof. The round sits between product-market fit and scaled execution, so investor standards shift from “could this work” to “is this working predictably.” A $20M to $50M check requires evidence that your growth engine runs without the CEO pushing every lever.
Numbers alone do not close Series B rounds. Investors read metrics as one connected narrative about scalable growth, capital efficiency, and market defensibility. A $6M ARR business growing 3x with 125% NRR tells a stronger story than a $10M ARR business growing 2x with flat retention.
The Five Metrics Series B Investors Actually Track
Forget vanity numbers. These five signals drive every Series B decision:
• Annual Recurring Revenue (ARR): $5M to $15M is the target window, with $8M to $10M being the sweet spot for most institutional funds.
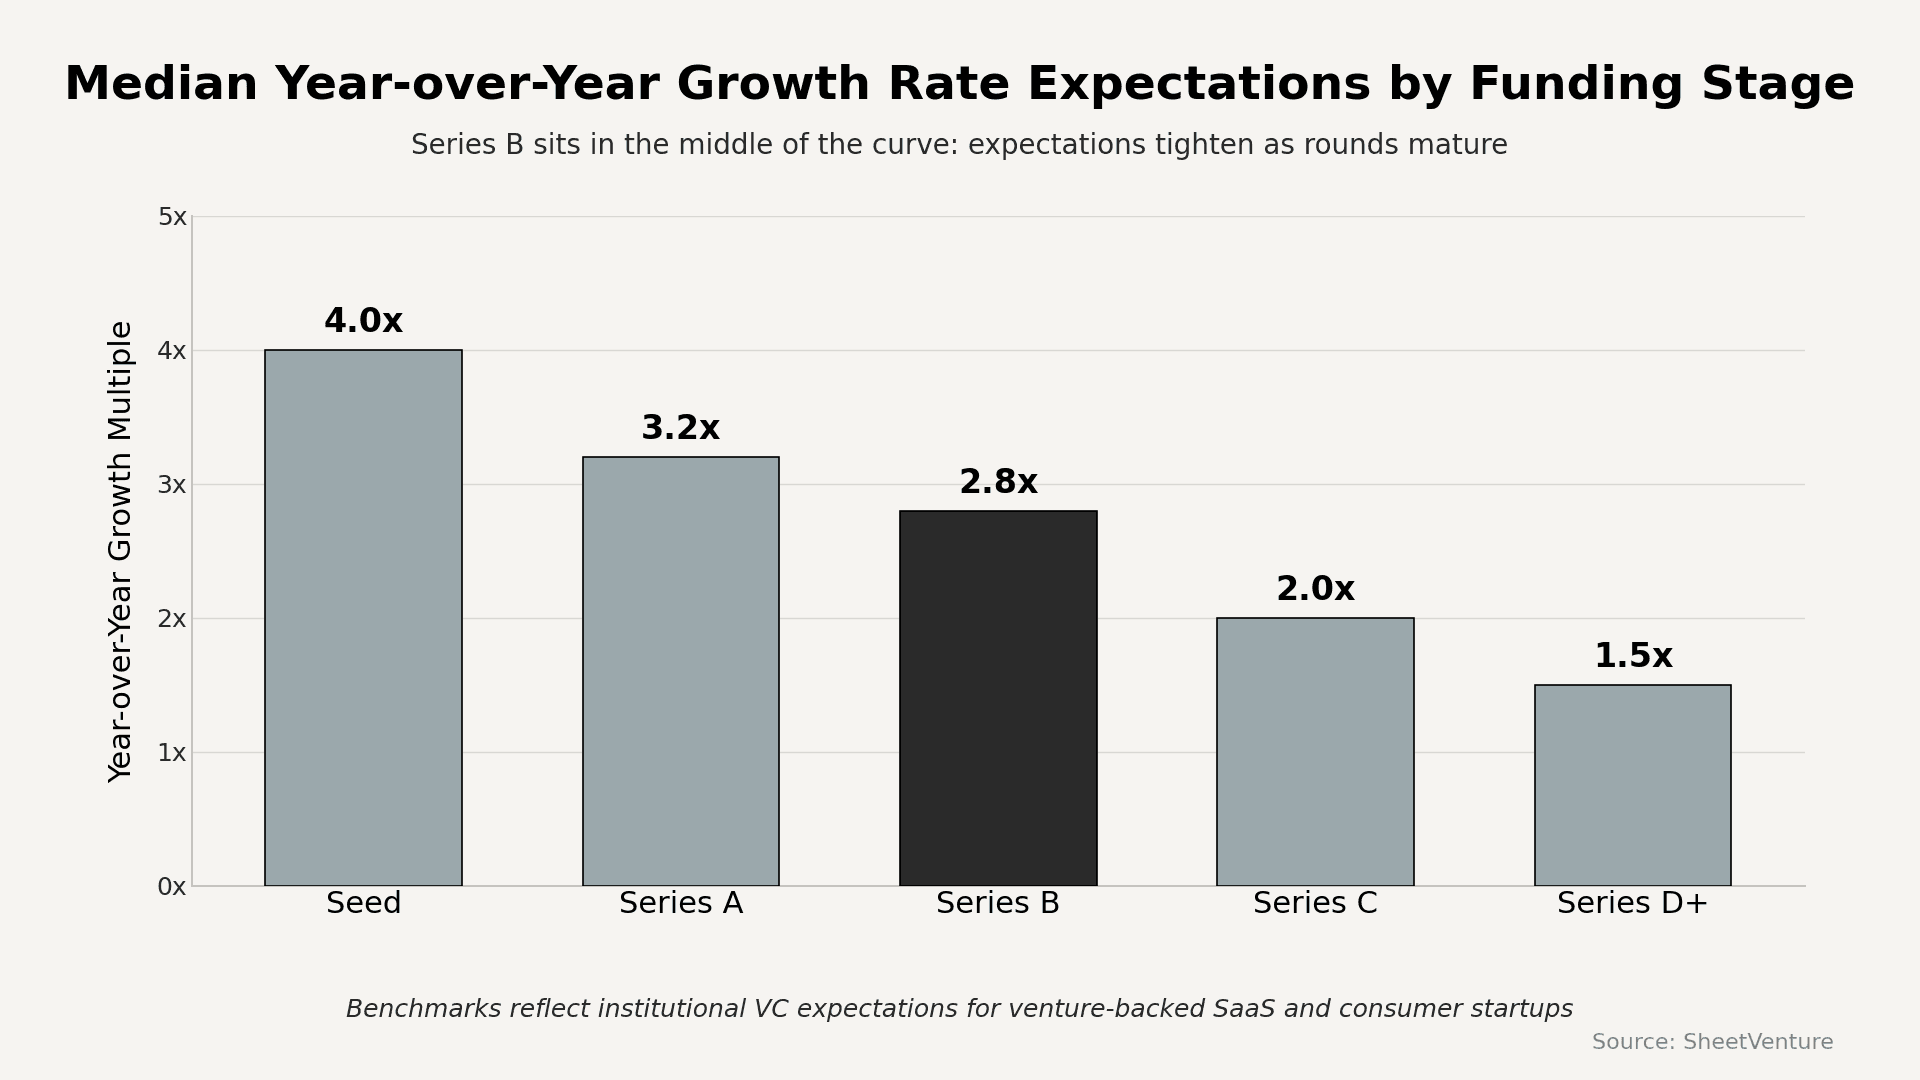
• Year-over-year growth rate: 2.5x to 3x minimum, with top-decile rounds clearing 3x to 5x.
• Net revenue retention (NRR): 120% or higher proves existing customers expand faster than they churn.
• Gross margins: 70% or better for SaaS, confirming the business model scales profitably.
• CAC payback period: Under 18 months, with category leaders hitting 12 months or less.
Growth Rate Context Beats Absolute Numbers
Series B investors benchmark growth against stage and category:
• Vertical SaaS: 2.5x year-over-year is respectable, 3.5x is exceptional.
• Horizontal SaaS: 3x is the baseline; below triggers concern.
• Marketplaces: 4x to 5x GMV growth expected.
• Consumer subscription: 3x revenue plus retention curves that hold.
• Developer tools and infrastructure: 3x ARR with strong usage expansion.
• Fintech and insurance: 2.5x ARR with strong regulatory moat and unit economics.
A startup at 2x growth with $12M ARR has a harder story than one at 3.5x growth with $6M ARR.
Retention Separates Ready From Wishful
NRR is the single metric that kills more otherwise strong Series B rounds than any other:
• Below 100%: Red flag, customers shrinking or churning.
• 100% to 110%: Acceptable, not compelling.
• 110% to 120%: Healthy expansion signal.
• 120% and above: Threshold that unlocks premium valuations.
• 130% and above: Elite territory, rare and highly prized.
Gross retention matters equally. Below 85% annual signals stickiness problems, capital cannot fix.
Unit Economics That Justify a Larger Check
Series B money funds the scale phase. Investors need proof that your engine runs profitably as you pour fuel in:
• LTV to CAC ratio: 3:1 minimum, 4:1 or higher preferred.
• Gross margin: 70% plus for SaaS, 50% plus for consumer, 30% plus for marketplaces.
• Magic Number: 1.0 or higher proves sales efficiency at scale.
• Burn multiple: Under 2x, meaning less than $2 burned for every $1 of net new ARR.
Cohort-level unit economics often decide diligence outcomes.
Market Signals Investors Quietly Check
Beyond financials, Series B investors test for expansion readiness:
• Multi-product attach or a credible product roadmap.
• Enterprise pipeline growing if you started in the mid-market.
• International traction or a documented playbook.
• Sales team hitting quota with predictable ramp times.
• Win rates are stable or climbing against known competitors.
Benchmark your numbers against funded comparables using a private market intelligence platform before investors run the same comparison themselves.
Common Gaps That Kill Series B Rounds
Most rejected Series B startups miss one of four issues:
• Growth decelerating quarter over quarter without a clear explanation.
• Retention softening as the customer base matures.
• CAC climbing while deal sizes stay flat.
• Concentration risk where a few customers drive most revenue.
For a full preparation framework, this Series B playbook covers diligence readiness, positioning, and process design.
Review traction quality indicators to confirm your growth will hold at scale, and progress benchmarks to pace your raise correctly against investor expectations.
The Bottom Line
Series B readiness is not one number. It is a stack of five metrics that together prove your business scales profitably: $5M to $15M ARR, 3x growth, 120% NRR, 70% gross margins, and CAC payback under 18 months. Hit most of these, and the conversation shifts from “should we invest” to “what terms.” Miss them, and no deck narrative closes the gap.
SheetVenture helps founders benchmark traction against active Series B funds so your metrics meet the exact bar each firm uses before you pitch SheetVenture.
Last Update:
Everything you need to understand private markets
Understand your market in real-time.
Filter by stage, sector, and exact geography.
Access 30,000+ verified, daily-updated active
